Bitcoin Today: Critical $100K Support Under Pressure as Market Signals Turn Bearish
Table of Contents
Bitcoin faces a critical juncture as it navigates extreme volatility in early November 2025, with the cryptocurrency’s psychological and technical support near $100,000 experiencing renewed downward pressure amid shifting market dynamics. Today’s price action reveals a complex interplay between on-chain weakness, declining institutional demand, and shifting monetary policy signals—factors that will determine whether Bitcoin rebounds or faces a deeper correction in the coming weeks.
Current Bitcoin Price Action and Technical Pressure
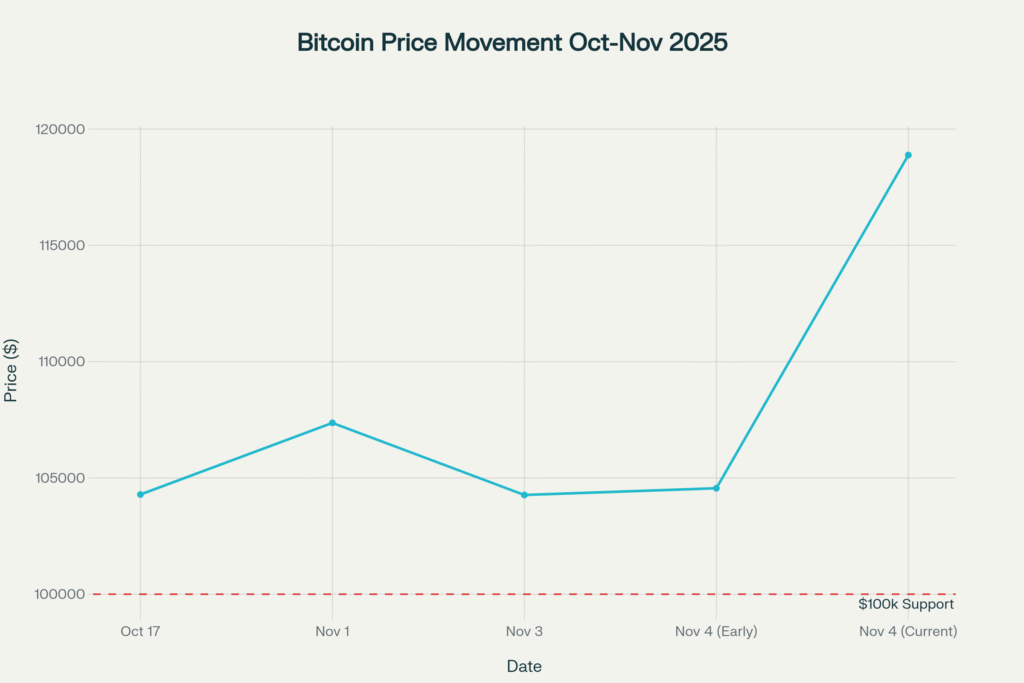
Bitcoin is currently trading near $118,885, but this figure masks the underlying fragility of the cryptocurrency’s position. The asset opened November following the worst October performance in a decade, with a 3.69% monthly loss that broke a remarkable seven-year “Uptober” streak. More concerning, Bitcoin had been trading as low as $104,288 on November 3, representing a retreat from its 2025 all-time high of $122,979 reached on July 14.
The $100,000 support level represents far more than a round number—it serves as the psychological and technical floor that separates a manageable pullback from a potential bear market. Bitcoin has held above this level since May, but that floor is now being severely tested. Technical analysts warn that Bitcoin is currently in “absolute free fall,” with no clear support identified until prices reach the $100,000 region. If this critical level breaks, the next target appears to be $92,000 to $94,000, where a CME futures gap sits waiting to be filled. An extended decline could push Bitcoin toward $85,000, though this remains within the broader bull market structure established earlier in the year.
The Breakdown of Institutional Support
One of the most alarming developments for Bitcoin bulls is the dramatic collapse in institutional flows. Bitcoin ETF inflows have plummeted by 90% compared to 2024 levels, with BlackRock’s spot Bitcoin ETF receiving less than 1,000 BTC per week, down from over 10,000 BTC weekly inflows earlier in the cycle. This sharp reduction in institutional buying pressure coincides with negative demand patterns typically seen at local market bottoms, suggesting either capitulation selling or institutional caution about near-term price direction.
Bitcoin treasury firms have also reduced their aggressive purchasing strategies, signaling waning confidence in the near-term outlook. This institutional pullback stands in stark contrast to 2024, when institutional adoption accelerated dramatically following regulatory breakthroughs, particularly the approval of spot Bitcoin ETFs in the United States.
Stock Market Correlation: The Double-Edged Sword
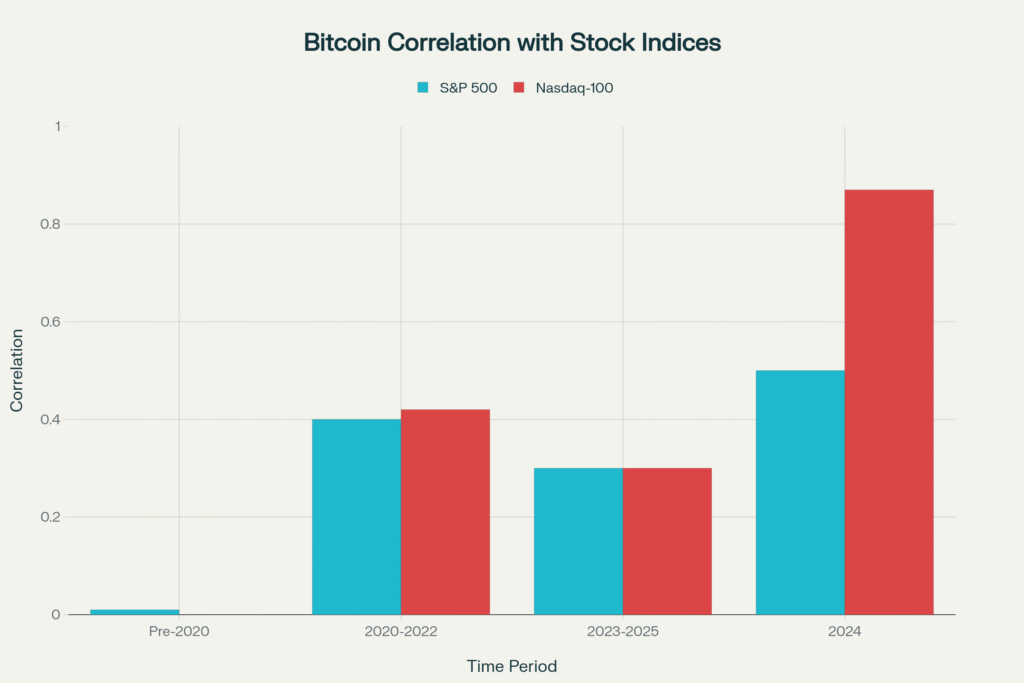
The relationship between Bitcoin and equity markets has fundamentally transformed since 2020. Research reveals that Bitcoin’s correlation with major equity indices has risen dramatically over the past five years. Before Bitcoin ETFs were introduced, correlations were essentially zero or even negative—Bitcoin truly functioned as digital gold with portfolio diversification benefits. However, post-2020, Bitcoin-to-S&P 500 correlation rose to 0.40 in 2022, and Bitcoin-to-Nasdaq correlation spiked to 0.87 in 2024 following MicroStrategy’s inclusion in the Nasdaq-100.
This elevated correlation cuts both ways. When stock markets rally on “risk-on” sentiment, Bitcoin benefits from increased appetite for higher-yielding assets. However, when equities stumble, Bitcoin increasingly moves in tandem—behaving like a volatile tech stock rather than an uncorrelated alternative asset. Current stock market weakness therefore directly pressures Bitcoin’s technical support levels.
The S&P 500 has delivered a strong 16% to 19.6% gain year-to-date, but recent cracks are forming. Wall Street bank CEOs have begun warning of potential equity market drawdowns, and technical breadth indicators show deterioration, with more than 300 stocks in the S&P 500 closing in negative territory despite index-level strength. This market concentration—with gains driven primarily by megacap technology stocks—creates vulnerability if sentiment shifts.
Monetary Policy Uncertainty and Its Impact
The Federal Reserve’s recent interest rate cut to 3.75%-4.00% in October initially supported risk assets, but Chair Powell’s subsequent statement that December rate cuts are “not a foregone conclusion” has introduced significant uncertainty. Market expectations for a December rate cut have declined from 90% to approximately 72% over the past week.
This hawkish shift matters greatly for Bitcoin. Lower interest rates typically reduce the opportunity cost of holding non-yielding assets like Bitcoin. Higher rates encourage investors to favor yield-bearing instruments. The Fed’s more cautious stance, coupled with inflation remaining “somewhat elevated” above the 2% target, suggests the era of easy monetary policy may be concluding sooner than previously expected. Don’t miss our recent post about PLTR Stock Q4 Earnings Forecast: Palantir Beats Estimates but Valuation Worries Weigh on Shares.
The On-Chain Narrative: Accumulation Turning to Distribution
On-chain metrics tell a story of shifting market psychology. The Net Unrealized Profit/Loss (NUPL) metric, which measures whether Bitcoin holders are in profit or loss positions, recently hit 0.47—its lowest level since April. This suggests that recent buyers are underwater and potentially vulnerable to capitulation selling. Additionally, analysts flag the formation of a “head and shoulders” bearish pattern on Bitcoin’s price chart, which historically precedes significant downside moves.
However, not all signals are bearish. Long-term Bitcoin holders remain strategically positioned, with whale accumulation continuing despite price weakness. Wallets holding 1,000 to 100,000 ETH (equivalent positions exist in Bitcoin) added substantial holdings in recent months, suggesting sophisticated investors view current weakness as a buying opportunity rather than a capitulation moment.
What Happens if Bitcoin Breaks Below $100,000?
The path forward depends critically on whether Bitcoin holds its $100,000 support. A decisive break below this level would likely trigger two scenarios. The most likely near-term outcome is a correction to $92,000-$94,000, where technical confluences (Fibonacci levels, CME gaps, and historical liquidity zones) may halt the decline. However, if selling accelerates, Bitcoin could extend losses toward $85,000, though this would still represent a position higher than prices seen in April 2025.
Standard Chartered analysts have explicitly warned that Bitcoin could test these lower levels before resuming an uptrend, suggesting major banks are positioning for a more significant pullback than many retail investors anticipate. The risk-reward for holding through this volatility is increasingly asymmetrical—the potential downside exceeds the near-term upside given current technical damage.
The Stock Market Connection Matters
For Bitcoin investors, monitoring equity market health has become essential. If the S&P 500 breaks significant support levels around 6,750-6,800, the resulting “risk-off” sentiment could severely pressure Bitcoin’s ability to hold the $100,000 level. Conversely, if the stock market stabilizes and begins recovering, Bitcoin could find footing and eventually break above resistance near $110,000-$113,000.
The key metrics to watch include Treasury bond yields (particularly the 10-year rate, currently around 4.11%), equity market breadth indicators, and Federal Reserve communication ahead of the December policy meeting. Any of these could serve as catalysts for Bitcoin’s next significant move.
Seasonal Tailwinds May Provide Support
One potential mitigating factor is seasonal strength. Historically, November has been one of Bitcoin’s strongest months, with average gains around 42.31% in recent years. Combined with technical support at $100,000 and potential long-term holder accumulation, Bitcoin could potentially stabilize and recover toward $110,000-$120,000 before year-end. However, this would require institutional buyers to re-engage, which currently appears unlikely given the sharp decline in ETF flows.
Investment Implications
For investors focused primarily on traditional stock markets, Bitcoin’s behavior matters as a leading indicator of broader risk appetite shifts. When Bitcoin breaks down decisively, it often signals reduced appetite for risk assets more broadly. The current test of the $100,000 support level is therefore worth monitoring closely as a potential warning sign for equity markets.
Given the confluence of factors—declining institutional flows, deteriorating technical structure, rising correlation with equities, and stock market weakness—the path of least resistance for Bitcoin appears downward over the next 2-4 weeks. A break below $100,000 would likely accelerate selling toward $92,000-$94,000. However, the longer-term bull market structure remains intact, and institutional adoption trends still support higher prices eventually.
The coming days represent a critical inflection point. Bitcoin holders and market observers should pay close attention to volume patterns around the $100,000 level, any major stock market moves, and Federal Reserve commentary. These factors will determine whether November becomes a recovery month or the beginning of a more significant correction.
Disclaimer:
The content shared by telavivdeclick is solely for research and informational purposes.